
Google Chromes internal chrome:// pages contain experimental features, diagnostic tools and detailed statistics. Theyre hidden in Chromes user interface, so you have to know they exist to find them. These hidden pages are Chromes version of Firefoxs about
: pages.
You can access each by typing chrome://, followed by the name of the page you can also use the more traditional about
: prefix, which redirects you to the chrome:// URL.
Chrome://About
The chrome://about page lists all Chromes internal pages. Click any of the links to access the page. Many of them are the same pages you can access from Chromes menus for example, chrome://bookmarks is the bookmarks manager and chrome://settings is Chromes options page.

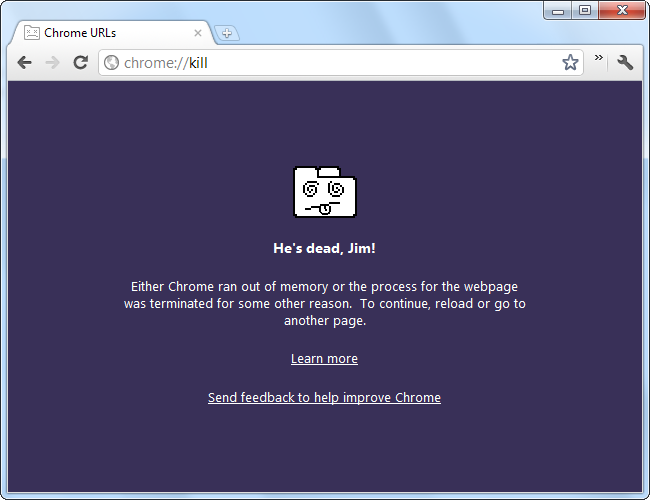
There are also a few special URLs for debugging purposes located near the bottom of the page for example, you can enter chrome://kill in the address bar to kill the current tab.
Chrome://Flags
The chrome://flags page, formerly known as the chrome://labs page, is probably the most interesting internal page. This page contains a treasure trove of experimental features that arent yet enabled by default Google warns you that your browser may spontaneously combust if you enable these features. They may have security, privacy or stability problems or cause data loss. Use these options at your own risk!

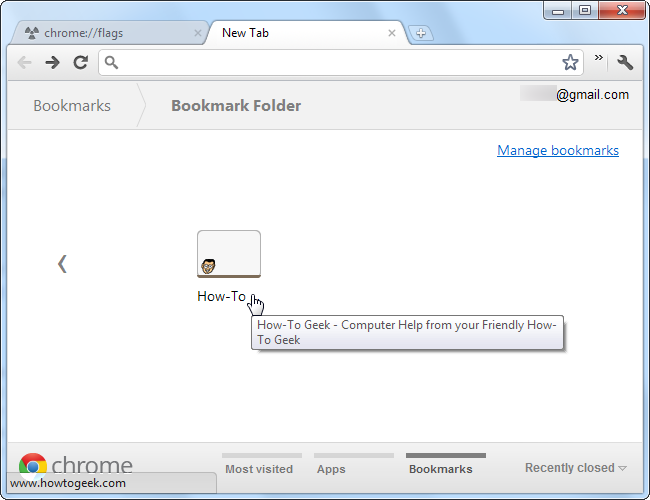
New features often turn up here before they become enabled by default. For example, you can enable the Enable NTP Bookmark Features option to add the experimental bookmark interface to Chromes new tab page. The new bookmark manager isnt enabled by default in Chrome 16, but it probably will be in a newer version.
Chrome://Sessions
Another feature buried on Chromes chrome://flags page is the Enable Syncing Open Tabs option, which adds an Open Tabs option to Chromes sync settings.
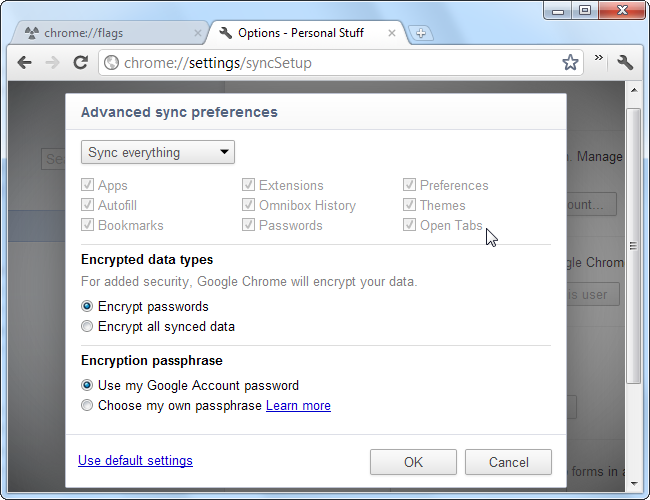
After you enable this option, youll find a list of your other browser sessions on the chrome://sessions page. This feature will eventually be enabled by default and exposed in Chromes user interface, but you can use it now.

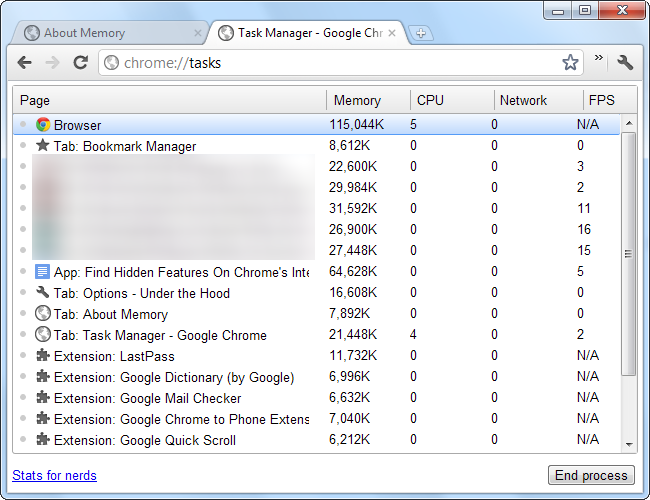
Chrome://Memory & Chrome://Tasks
The chrome://memory page gives you a breakdown of Chromes memory usage. It shows you just how much memory each extension, app and web page is using. If other browsers, such as Mozilla Firefox or Internet Explorer, are running, itll also show the other browsers memory usage.
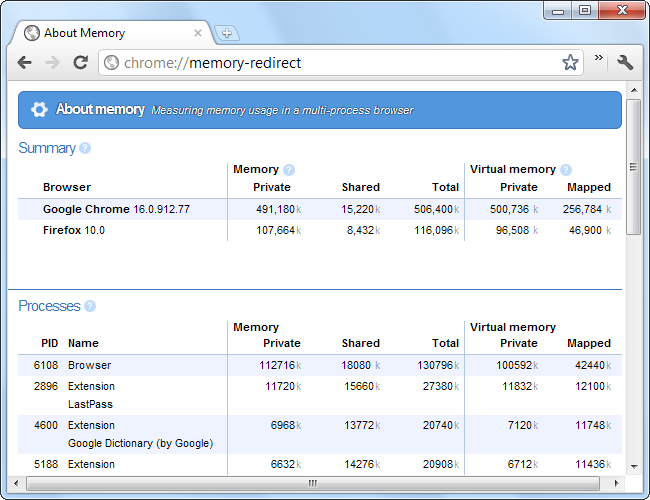
This is the same page you can access by clicking the Stats for nerds link at the bottom of Chromes Task Manager window. Open the Task Manager by right-clicking Chromes title bar and selecting Task Manager or access the chrome://tasks URL to open it in a tab.
Chrome://Net-Internals
The chrome://net-internals page is packed full of network diagnostic information and tools. It can capture network data and dump it to a file, making it a useful tool for troubleshooting Chrome network problems.
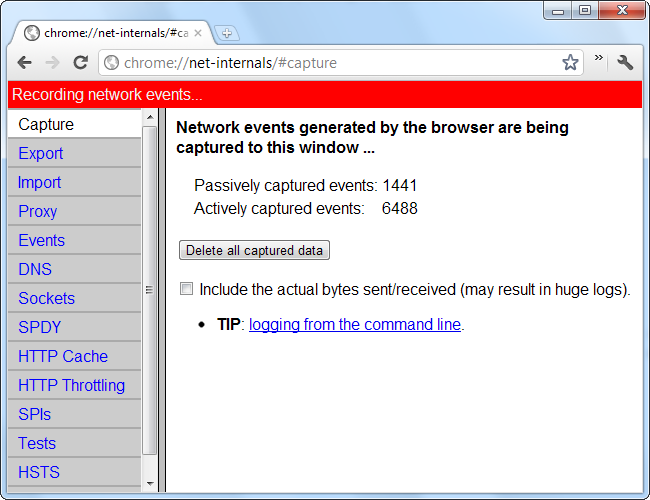
Most of the tools here wont be useful to average users, but the Tests page contains a particularly useful tool. If a website wont load, you can plug its address into the Tests page and Chrome will attempt to determine the problem for you.

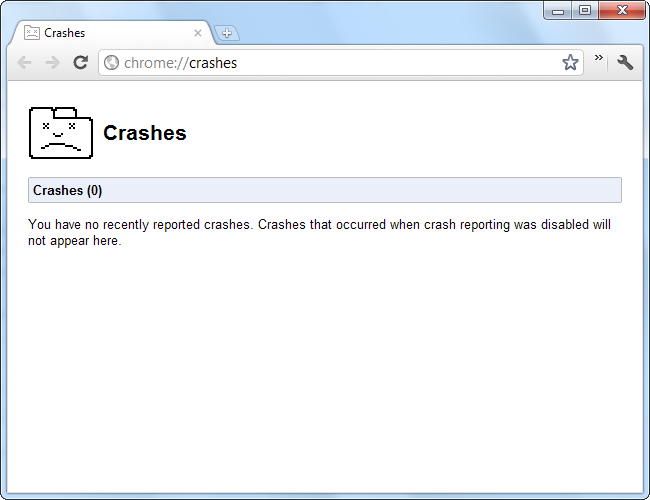
Chrome://Crashes
The chrome://crashes page lists crashes that have occurred. Youll only see crashes here if you have the Automatically send usage statistics and crash reports to Google option enabled on the Under the Hood tab in Chromes settings.
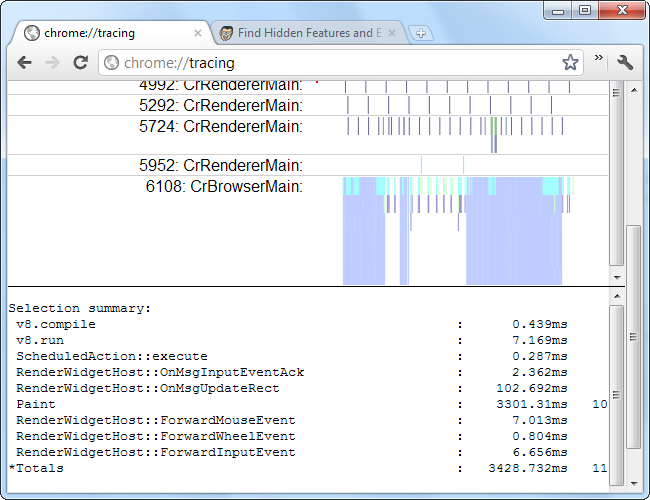
Chrome://Tracing
The chrome://tracing page is a developer tool that allows you to analyze Chromes performance. Click Record and Chrome will start logging browser activity.

After stopping the record process, you can dig into the activity and see whats taking up the most time. If you have a page that performs slowly in Chrome, you can see what part of your code Chrome is struggling with.
Many of the other pages are technical pages listing debug information. For example, the chrome://flash page lists information about the flash plug-in and the chrome://sync-internals page displays the state of Chromes sync process. Feel free to explore the rest on your own.